Learn

  • Discover what Elasticsearch, Fluentd, and Kibana are (aka the EFK stack)
  • See how to implement a centralized monitoring and logging platform with these technologies
  • Discover what Kubernetes is and how to create a Kubernetes cluster in GCP for modern, containerized applications
  • Deploy applications from Kubernetes to the cloud
  • Scale the number of applications running in Kubernetes
  • Install and configure monitoring and logging agents on the Kubernetes nodes
  • Create powerful visualizations for metrics stored Kibana
  • Effectively and efficiently analyze logs stored in Kibana

About

Kubernetes is an open source platform designed to automate deployment, scaling, and operation of application containers. Kubernetes automates various aspects of application development, which is extremely beneficial for enterprises. Centralized logging is crucial for any production-grade infrastructure, especially in a containerized architecture. Since Kubernetes is dynamic and does not store change logs except the recent changes, logging and monitoring is highly imperative for saving pod logs.

In this course, you’ll learn to analyze and locate critical pod log files in your Kubernetes clusters. You’ll create a centralized logging system with a configured EFK (Elasticsearch, Fluentd, and Kibana) stack for Kubernetes. Using a hands-on approach, you’ll follow the entire logging and monitoring process, which actually goes hand-in-hand. In your Kubernetes cluster, you’ll find out that your clusters are working with too many containers and it’s difficult to keep track of each of them.

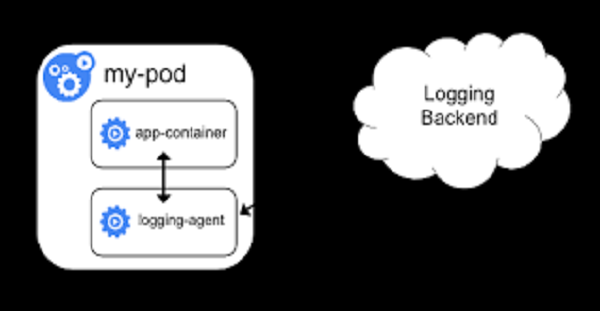
You’ll learn how to build your centralized logging and send data for monitoring. To set up centralized logging, you’ll establish one logging agent per Kubernetes node to collect all logs of all running containers from disk and transmit them to Elasticsearch. You’ll search for log data, monitor the containers, and also collect metrics using Kibana. You’ll decide how your final log data will be presented. By the end of the course, you’ll be able to use centralized logging and monitoring techniques for debugging purposes to find out reasons for crashes, and trigger alerts if there is a spike in error messages (which can be more efficient than a system health check).

Features

  • This video course provides a comprehensive overview of the EFK stack, along with practical advice on how to implement it to observe applications running in Kubernetes
  • Learn how to ship Kubernetes metrics and logs to a centrally managed monitoring and logging platform
  • Gain the knowledge to create powerful and meaningful dashboards in Kibana, and bring application metrics and logs to the surface for developers and stakeholders to visualize more clearly
  • Ultimately, you will learn how to analyze and search through logs stored in Kibana to more effectively debug and troubleshoot applications when problems occur

Course Length : 0 hours 49 minutes

ISBN : 9781838558673

Requirements

Add information about the skills and knowledge students need to take this course.

Author

Walter Dolce

Walter Dolce is a software and platform engineer based in London, UK. He has worked for both small/medium-sized businesses as well as large enterprises such as the BBC and Just Eat. Over the years, he has developed a deep knowledge of various software engineering concepts and practices, such as test-driven development, behavior-driven development, the SOLID principles, and design patterns. More recently, he transitioned to the DevOps/platform engineering space where he has utilized his knowledge to implement highly available, resilient systems and platforms running in today’s major cloud providers (including Amazon Web Services, Google Cloud Platform, and Microsoft Azure). Walter has already authored video courses for Packt entitled “Creating a Continuous Deployment Pipeline” and “Hands-On Kubernetes Networking”. Linkedin - https://www.linkedin.com/in/walterdolce/

Frequently Asked Questions

What web browser should I use?

The Open edX platform works best with current versions of Chrome, Firefox or Safari, or with Internet Explorer version 9 and above.

See our list of supported browsers for the most up-to-date information.

respond
hours per week
respond
Free
respond
RPS
respond
en

Share this course

Categories

Data Science(241)

Coding and Tools(37)

Admin and Cloud(380)

DevOps(78)

Programming(631)

Application Development(752)

Web Development(547)

Big Data and Analytics(709)

Soft Skills(19)

Network Security & Infrastructure(283)

Process Concepts(8)

Database(80)

Business Intelligence(22)

I've read enough.Take me to RPS